

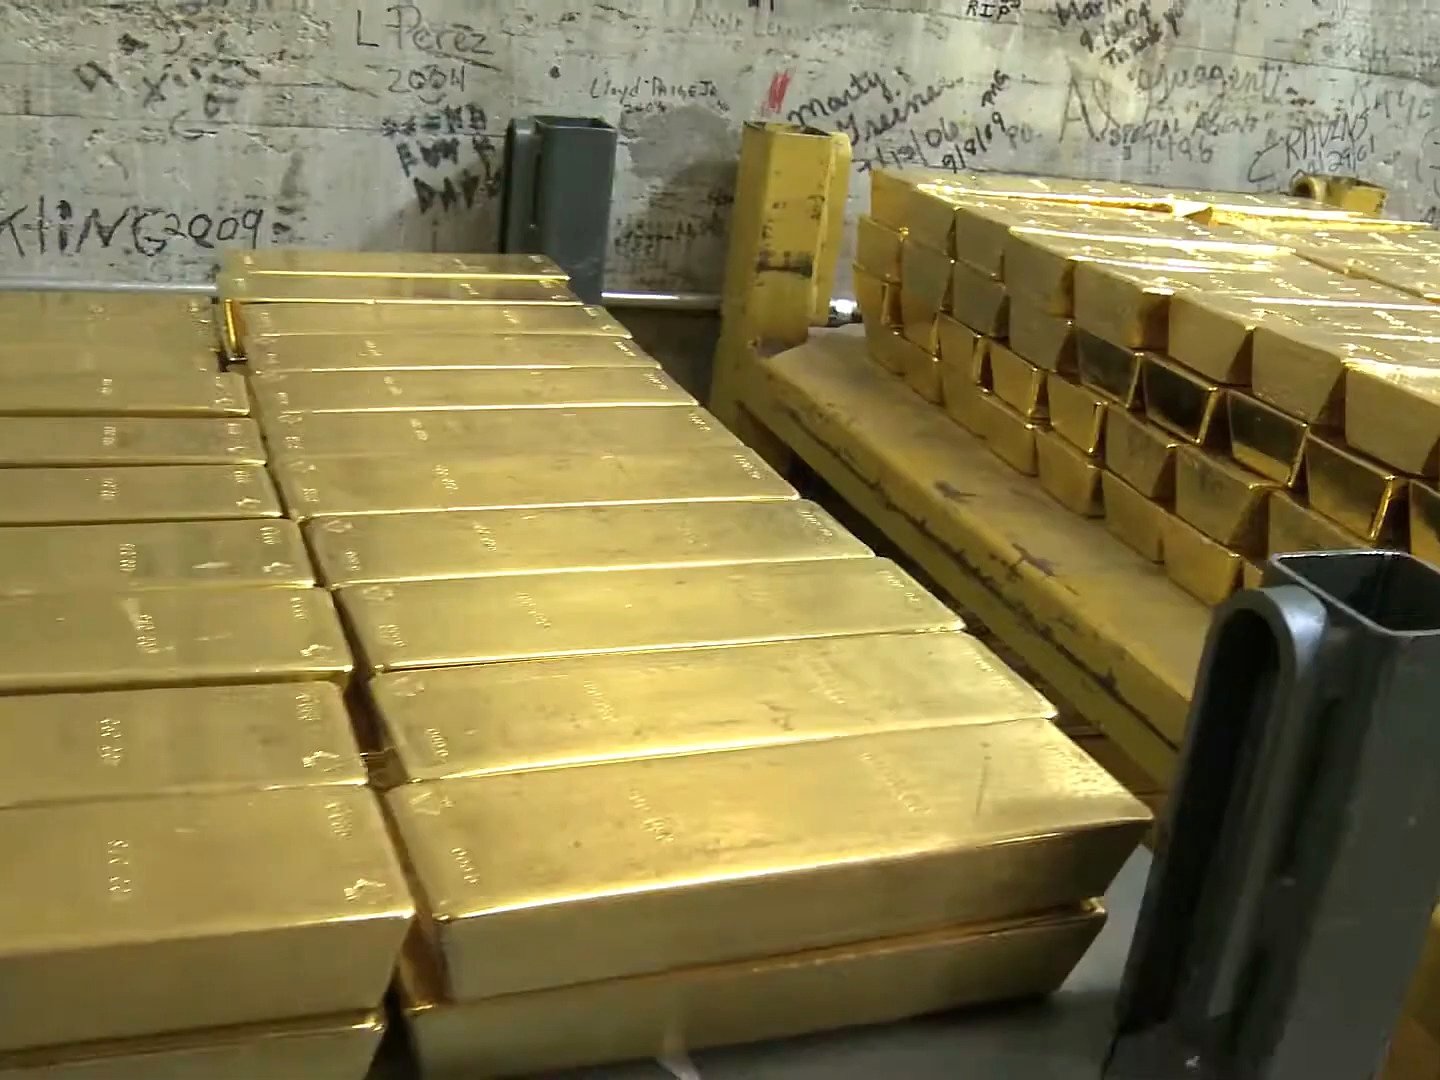
Will gold go down more? It can, and a retest of $3,500 or lower is a real scenario, but only if a specific chain of things breaks. Gold sat near $4,057 in late July 2026 (Kitco, July 21, 2026) after a rough stretch, and the bears aren’t cranks. They’ve got a Fed that might hike again, a chart pattern pointing lower, and a pile of underwater ETF buyers. For gold to slide toward $3,500 and beyond, the $3,300 to $3,400 support zone has to fail and the Fed has to keep tightening. Short of that, the deeper downside stays theoretical. Here’s the honest version of both sides.
What has to break for a $3,500 retest
Snippet answer: for gold to retest $3,500, the $3,300 to $3,400 support band has to give way, confirming a head-and-shoulders pattern that projects toward $2,575 to $2,750 (Mitrade). The trigger is the Fed pricing in three to four more rate hikes, which lifts real yields and the dollar. Hold that support, and the retest doesn’t happen.
Everything below is a variation on that setup. The bears need higher-for-longer rates to do the heavy lifting, because gold pays no yield and hates competition from cash and bonds.
The bear case, laid out fairly
We’re not going to strawman this. The correction case for gold in late 2026 is coherent, and it rests on four legs.
- The September hike risk. Markets were pricing roughly 64% to 68% odds of a September rate hike under Fed Chair Kevin Warsh (Expert Quote Bank, July 2026). A hike, or even the credible threat of a string of them, pushes real yields up and gold down.
- The technical target. Mitrade’s head-and-shoulders read points to $2,575 to $2,750 if the $3,300 to $3,400 support fails. That’s not a forecast that support will fail, it’s a measured objective for if it does.
- ETF holders in the red. Roughly 298 tonnes of ETF gold was bought near the highs and now sits underwater (Price Catalysts Report, July 23, 2026). That’s an overhang of nervous holders who may sell into any bounce, capping rallies and feeding downside.
- Analyst targets below spot. Two respected desks see lower before higher.
On that last point, the numbers are specific. Deutsche Bank’s Michael Hsueh laid out the mechanism plainly.
“Gold to $3,800 if markets begin pricing in three to four additional rate hikes.” Michael Hsueh, Deutsche Bank (Yahoo Finance, June 23, 2026)
Note the conditional. Hsueh isn’t calling for $3,800 outright. He’s saying that’s where gold goes if the rate picture turns meaningfully more hawkish. His alternative case, with Fed policy unchanged, is $4,800 in Q4. Same analyst, two paths, and the fork is the Fed.
TD Securities’ Bart Melek goes further on the downside before flipping bullish.
“Gold will fall below $3,900 this year before bottoming, then rallies above $5,300 in 2027.” Bart Melek, Head of Commodity Strategy, TD Securities (Kitco, June 29, 2026)
Read Melek carefully, because he’s the most useful voice here. He’s a bear on the near term and a raging bull on 2027. His view isn’t “the move is over.” It’s “the move needs to flush out weak hands first.” That’s a very different thing from a structural top, and it’s worth holding onto as we get to the rebuttal.
Why $3,500 is a stretch, not a base case
Here’s where we push back on the loud bears. A retest of $3,500 requires a lot to go right for them, and several of those things are already contested.
First, the Fed narrative isn’t one-way. The same hawkish regime that pressured gold showed cracks. June payrolls came in weak at 57,000 versus 110,000 expected, and June CPI (released July 14) fell to 3.5% year over year from 4.2%, the largest monthly decline since April 2020 (Price Catalysts Report, July 23, 2026). Hsueh’s bearish scenario needs the market pricing three to four more hikes. Softening data pushes the other way. You can’t get to deep-correction gold on a Fed that’s about to pause or cut.
Second, the technical target is conditional on a support break that hasn’t happened. As of late July, gold was defending $4,000 to $4,021 (Kitco, July 21, 2026), well above the $3,300 to $3,400 zone that would need to fail. The head-and-shoulders objective only exists after the neckline breaks. It hadn’t.
Third, the official sector is still bidding underneath this market. Central banks bought a net 244 tonnes in Q1 2026 and China’s PBoC added 15 tonnes in June, its biggest month since October 2023 (Price Catalysts Report, July 23, 2026). That’s a patient buyer who accumulates on exactly the weakness the bears are counting on.
The bull rebuttal
Seabridge Gold’s Rudi Fronk put the counterpunch on the record, and it’s a clean one.
“We believe by the end of the year gold will be back through its all-time highs.” Rudi Fronk, Chairman & CEO, Seabridge Gold (Investing News Network, July 21, 2026)
Fronk went further, seeing another $1,000 per ounce possible within the following year. Given gold’s roughly $5,600 January 2026 all-time high, “back through its all-time highs by year-end” is an aggressive call from where we sit in late 2026. We’d treat it as the bullish outer edge, not the base case. But the direction of his argument lines up with something the bears keep glossing over: the structural drivers didn’t disappear during the correction.
The debasement trade is the core of it. U.S. deficits near $2 trillion, debt above $35 trillion (CBO, February 2026), and a Fed whose independence is under question. Sprott’s Paul Wong called it directly: “That’s the heart of the debasement trade. It’s still on, it’s still there” (Kitco, July 20, 2026). He also noted gold was trading oversold at minus two to minus three standard deviations and flagged a likely cyclical bottom before September, with Jackson Hole as a possible catalyst.
Even the cautious institutional voices don’t see a cliff. The World Gold Council’s mid-year outlook (July 1, 2026) figured that if gold dropped 10% to 15% from around $4,100, “further downside would likely be limited.” That’s the establishment view telling you the tail is fat but not bottomless.
Our honest read
Put it together and the picture isn’t a coin flip, it’s asymmetric with a real left tail. The most credible bears, Melek and Hsueh, are conditional bears who turn bullish once the flush is done. The unconditional case for $3,500 or lower needs the Fed to get more hawkish into softening data, needs $3,300 support to break, and needs central banks to walk away from a dip. That’s a lot of dominoes.
So can gold go down more? Yes. A move back toward $3,800, or a spike lower on a hawkish September surprise, is entirely on the table, and anyone telling you the correction is definitely over is selling something. But a durable retest of $3,500 and a slide toward the $2,575 to $2,750 technical target is a low-probability, high-impact scenario, not the default. Watch the $3,300 to $3,400 band and the September FOMC. Those two things decide it. Everything else is noise.
Frequently asked questions
Will gold go down more in late 2026?
It can. A near-term dip toward $3,800 is a live scenario if the Fed turns more hawkish, per Deutsche Bank’s Michael Hsueh (Yahoo Finance, June 23, 2026). But a deeper slide to $3,500 requires the $3,300 to $3,400 support to break, which hadn’t happened as of late July 2026.
What price would confirm a bigger gold correction?
A decisive break below the $3,300 to $3,400 support zone confirms the head-and-shoulders pattern and projects toward $2,575 to $2,750 (Mitrade). Until that neckline breaks, the deeper downside target is only theoretical.
Which analysts think gold will fall further?
TD Securities’ Bart Melek sees gold below $3,900 this year before bottoming (Kitco, June 29, 2026), and Deutsche Bank’s Michael Hsueh sees $3,800 if markets price three to four more hikes (Yahoo Finance, June 23, 2026). Both then turn bullish, with Melek calling for above $5,300 in 2027.
Why might gold not fall to $3,500?
Softening data undercuts the bear case: June payrolls missed badly and June CPI fell to 3.5% (Price Catalysts Report, July 23, 2026). Central banks bought a net 244 tonnes in Q1 2026 and keep accumulating on dips, and gold was defending $4,000 in late July, far above the support that would need to break.
What’s the bull rebuttal to the correction thesis?
Seabridge’s Rudi Fronk expects gold “back through its all-time highs” by year-end (INN, July 21, 2026), and Sprott’s Paul Wong says the debasement trade “is still on.” The structural drivers, deficits above $35 trillion in debt and questions over Fed independence, didn’t vanish during the correction.
For the wider set of price paths, see our gold price forecast for 2026, and if a lower entry is what you’re waiting for, our guide on how to buy gold. Central-bank demand data is tracked at gold.org.
By the Commodities Unfiltered desk. Last updated July 2026.
This is market analysis, not investment advice.
Leave a Reply